Market Insights – June 2022
Home listings up, sales down and prices starting to decrease to start the summer season. VANCOUVER, BC – July 5, 2022 – With interest rates and housing supply increasing, Metro Vancouver* home buyers are operating in a changing marketplace to begin the summer season.
The Real Estate Board of Greater Vancouver (REBGV) reports that residential home sales in the region totalled 2,444 in June 2022, a 35 per cent decrease from the 3,762 sales recorded in June 2021, and a 16.2 per cent decrease from the 2,918 homes sold in May 2022.
Last month’s sales were 23.3 per cent below the 10-year June sales average. “Home buyers have more selection to choose from and more time to make decisions than they did over the past year,” Daniel John, REBGV Chair said. “Rising interest rates and inflationary concerns are making buyers more cautious in today’s housing market, which is allowing listings to accumulate.”
There were 5,256 detached, attached and apartment properties newly listed for sale on the Multiple Listing Service® (MLS®) in Metro Vancouver in June 2022. This represents a 10.1 per cent decrease compared to the 5,849 homes listed in June 2021 and a 17.6 per cent decrease compared to May 2022 when 6,377 homes were listed. The total number of homes currently listed for sale on the MLS® system in Metro Vancouver is 10,425, a 3.8 per cent decrease compared to June 2021 (10,839) and a 4.1 per cent increase compared to May 2022 (10,010).
“We’re seeing downward pressure on home prices as we enter summer in Metro Vancouver due to declining home buyer activity, not increased supply,” John said. “To meet Metro Vancouver’s long-term housing demands, we still need to significantly increase housing supply.” For all property types, the sales-to-active listings ratio for June 2022 is 23.4 per cent. By property type, the ratio is 14.3 per cent for detached homes, 31.5 per cent for townhomes, and 30.2 per cent for apartments.
Generally, analysts say downward pressure on home prices occurs when the ratio dips below 12 per cent for a sustained period, while home prices often experience upward pressure when it surpasses 20 per cent over several months.
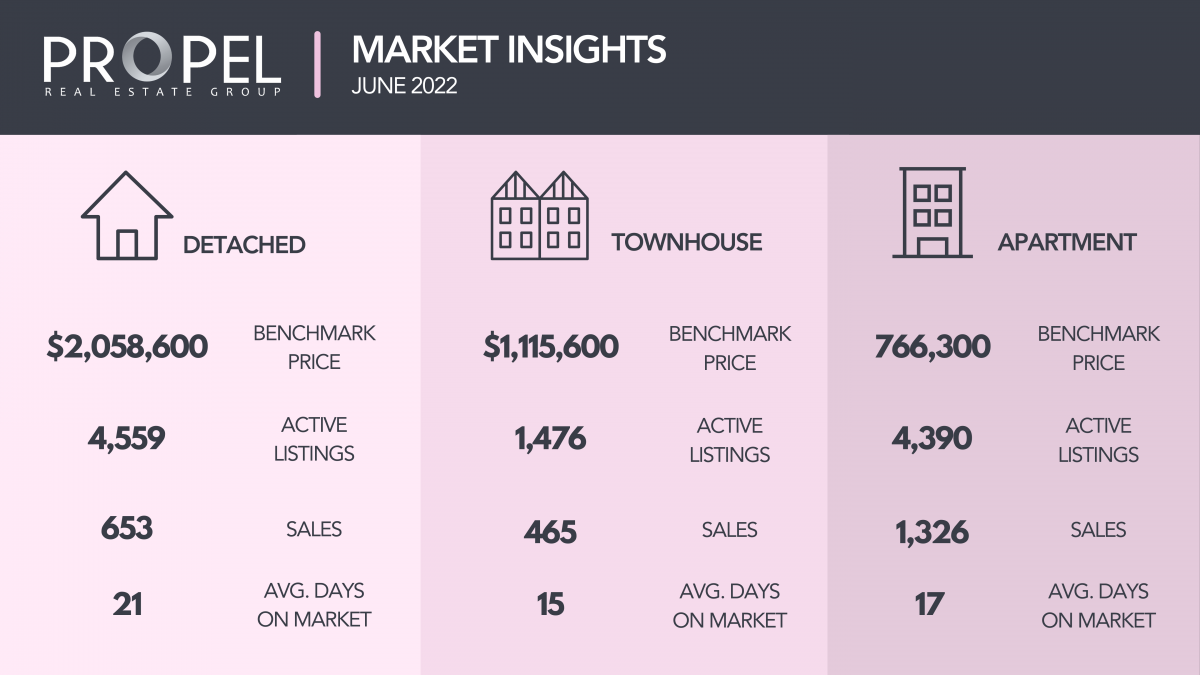
You can CLICK HERE to download the full Market Report. The image below is a concise summary of each housing category.