Burnaby East Real Estate Market Update – February 2025
Low Sales Volumes and Surging Inventory Create a Mixed Market
February 2025 sees Burnaby East grappling with a combination of rising inventory, low sales volumes, and varied pricing trends. Detached homes and condos are feeling the weight of slowing demand, while townhomes—though limited in sales volume—are seeing surprising year-over-year growth.
Here’s how the numbers break down this month and what they mean for buyers and sellers.
Key Market Stats for February 2025
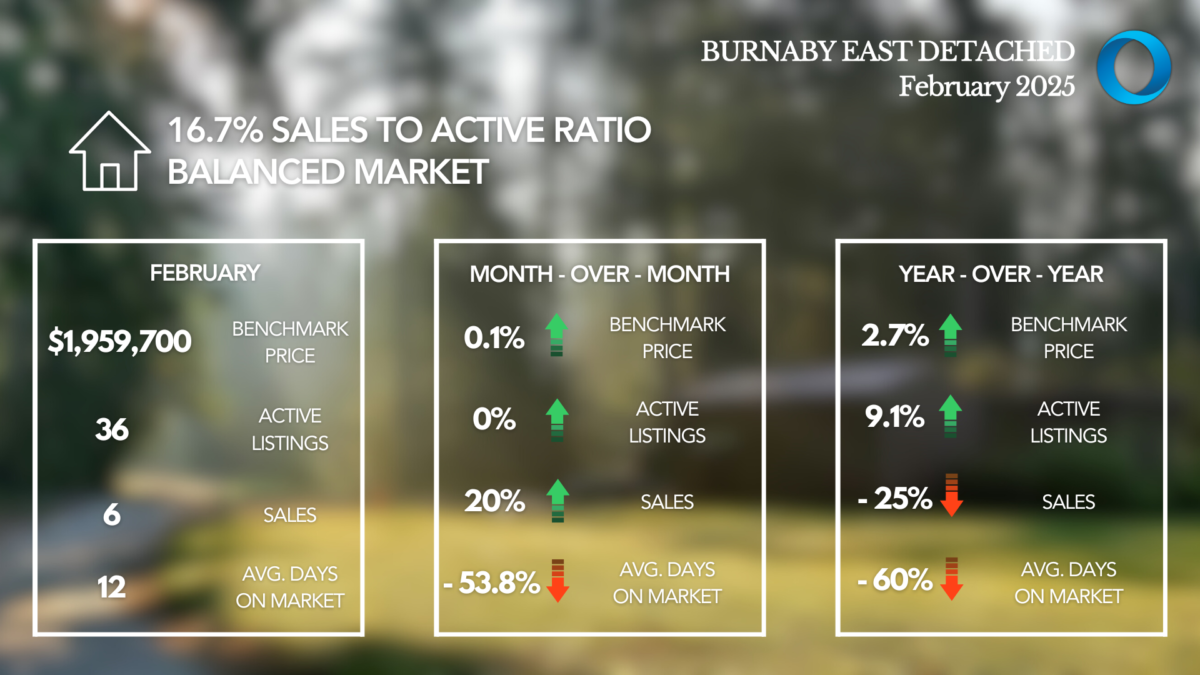
Detached Homes
- Total Active Listings: 36 (+9.1% YoY)
- Sales: 6 (-25.0% YoY)
- Days on Market Average: 12 (-60.0% YoY)
- MLS® HPI Benchmark Price: $1,959,700 (+2.7% YoY)
Condos
- Total Active Listings: 78 (+44.4% YoY)
- Sales: 9 (-30.8% YoY)
- Days on Market Average: 36 (-25.0% YoY)
- MLS® HPI Benchmark Price: $784,900 (-0.6% YoY)

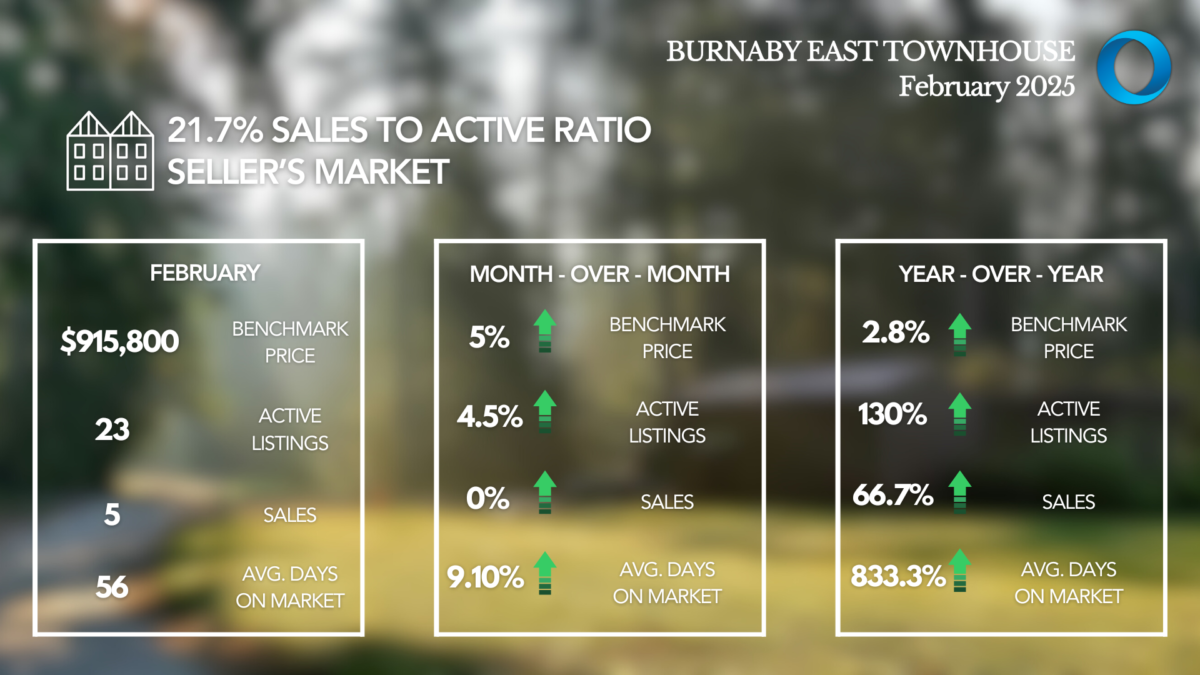
Townhomes
- Total Active Listings: 23 (+130.0% YoY)
- Sales: 5 (+66.7% YoY)
- Days on Market Average: 56 (+833.3% YoY)
- MLS® HPI Benchmark Price: $915,800 (+2.8% YoY)
Market Trends & Expert Insights
- Detached Homes: Minimal Sales Activity but Stable Prices The detached segment recorded only 6 sales this month, a 25% drop year-over-year, despite a moderate increase in inventory. Interestingly, homes are selling much faster—average days on market down to just 12 days—likely reflecting that only well-priced properties are moving. Despite fewer sales, prices are up 2.7% YoY, suggesting select high-demand properties are skewing the data.
- Condos: Significant Inventory Growth, Sales Slide Condo inventory continues to climb (+44.4% YoY) while sales fell nearly 31% year-over-year. Average days on market improved slightly (down 25% to 36 days), but pricing is starting to weaken, with the MLS® HPI Benchmark dipping 0.6% YoY. Buyer caution is clearly growing in this segment.
- Townhomes: Small Sample Size, Big Shifts The townhome market is highly volatile due to small sales volume. Inventory more than doubled (+130% YoY), but sales rose 66.7% off a low base. However, days on market skyrocketed to 56 days (up 833%), indicating potential misalignment between pricing and buyer expectations. Interestingly, the benchmark price still rose 2.8% YoY.
- Sales-to-Active Ratio Insights:
- Detached Homes: 16.7% (Balanced Market)
- Condos: 11.5% (Buyer’s Market Leaning)
- Townhomes: 21.7% (Balanced Market Leaning Toward Seller’s)
What This Means for Buyers & Sellers
For Buyers:
- Detached home buyers will find limited selection but may have room to negotiate as sales volume remains low.
- Condo buyers have the most leverage with growing supply and weakening prices.
- Townhome buyers should approach cautiously—rising inventory suggests opportunities may improve.
For Sellers:
- Detached home sellers must price sharply to stand out—homes are moving quickly when priced right.
- Condo sellers face the greatest challenge—competition is growing, and buyers are cautious.
- Townhome sellers should watch for shifting demand—pricing correctly is crucial as days on market rise.
Final Thoughts
Burnaby East is experiencing rising supply and softening demand in February 2025, with condos particularly under pressure. Detached homes are still finding buyers if priced right, while the townhome segment remains unpredictable due to limited sales data.
Download the Full Market Report
👉 Need insights specific to your neighborhood or building? Contact us for a tailored market report.