Burnaby South Real Estate Market Update – February 2025
Rising Inventory and Slower Sales Shift the Market Toward Buyers
February 2025 brings continued change to Burnaby South’s real estate market. Inventory levels are rising sharply across all property types, while sales activity—especially in condos and detached homes—is softening. Sellers are facing growing competition, and buyers have more options and negotiating power.
Let’s dive into the numbers and expert insights driving this month’s market performance.
Key Market Stats for February 2025
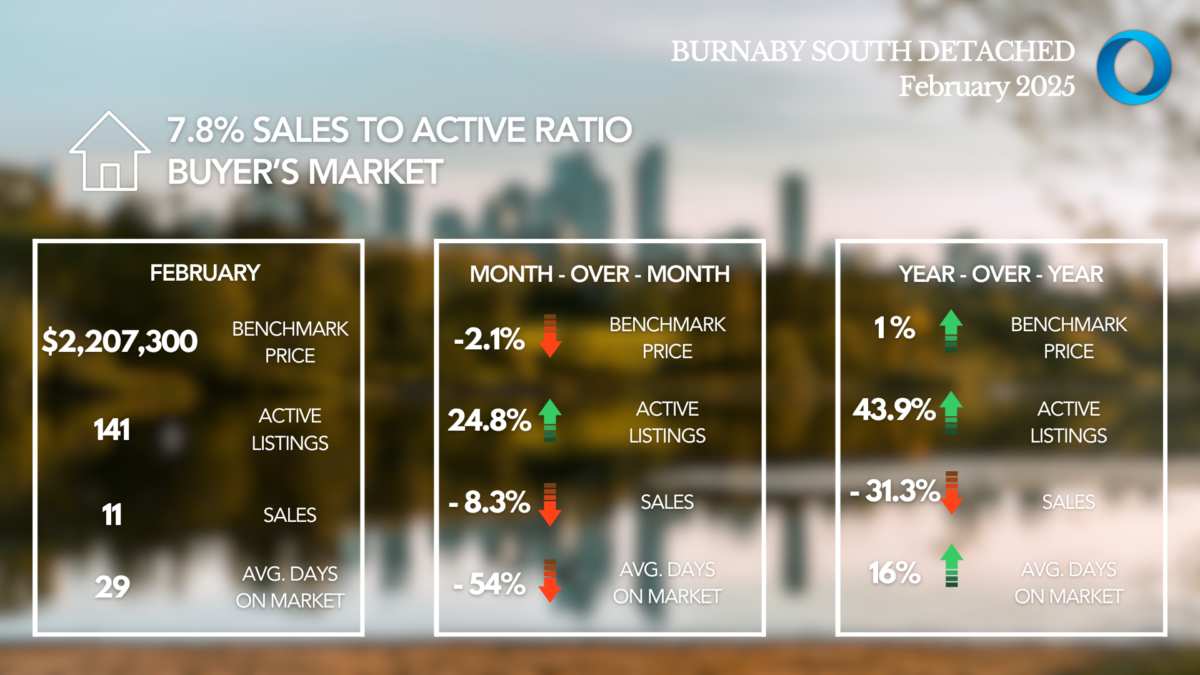
Detached Homes
- Total Active Listings: 141 (+43.9% YoY)
- Sales: 11 (-31.3% YoY)
- Days on Market Average: 29 (+16.0% YoY)
- MLS® HPI Benchmark Price: $2,207,300 (+1.0% YoY)
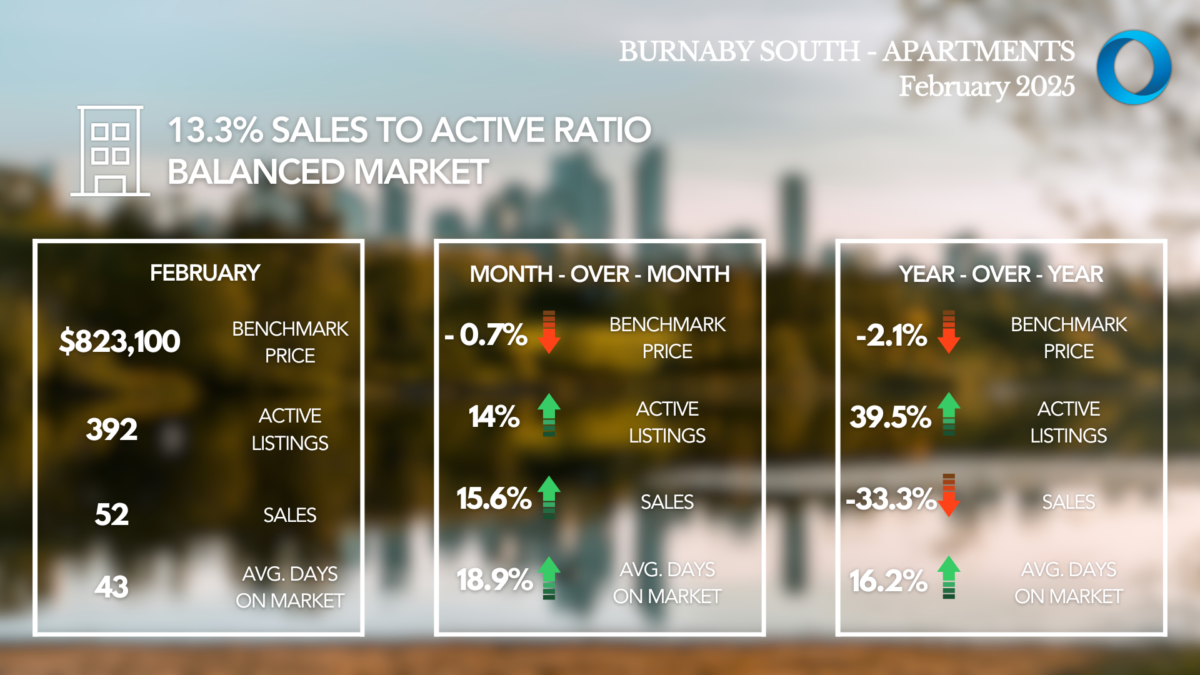
Condos
- Total Active Listings: 392 (+39.5% YoY)
- Sales: 52 (-33.3% YoY)
- Days on Market Average: 43 (+16.2% YoY)
- MLS® HPI Benchmark Price: $823,100 (-2.1% YoY)
Townhomes
- Total Active Listings: 41 (+10.8% YoY)
- Sales: 9 (No change YoY)
- Days on Market Average: 47 (+161.1% YoY)
- MLS® HPI Benchmark Price: $1,108,700 (+3.2% YoY)

Market Trends & Expert Insights
- Detached Homes: High Supply and Weaker Sales Detached listings surged 43.9% year-over-year, while sales dropped 31.3%. Homes are sitting longer, with average days on market rising to 29 days. Despite the slowing activity, prices remained stable with a 1.0% annual increase, though pressure may build if this trend continues.
- Condos: Rising Inventory Puts Pressure on Prices The condo segment saw the most dramatic shift, with active listings up 39.5% YoY and sales falling 33.3%. Average days on market increased to 43 days, showing softening demand. Prices responded, dropping 2.1% YoY, signaling growing buyer leverage.
- Townhomes: Sales Hold, but Properties Sit Longer Townhome inventory grew 10.8%, but sales held steady year-over-year. The notable shift is in days on market—up 161% to 47 days, indicating slower buyer activity. Despite that, the MLS® HPI Benchmark Price increased 3.2% YoY, suggesting some resilience in this segment.
- Sales-to-Active Ratio Insights:
- Detached Homes: 7.8% (Buyer’s Market)
- Condos: 13.3% (Balanced Market, shifting toward Buyer)
- Townhomes: 22.0% (Balanced Market, slight Seller edge)
What This Means for Buyers & Sellers
For Buyers:
- Detached home buyers are in a strong position to negotiate, with rising supply and slowing sales.
- Condo buyers will find ample selection and price softening opportunities.
- Townhome buyers should watch closely—although pricing is steady, longer days on market signal room for negotiation.
For Sellers:
- Detached sellers must price aggressively to attract interest in a cooling market.
- Condo sellers face increased competition—pricing and presentation will be crucial.
- Townhome sellers may still see interest but should manage expectations on time to sale.
Final Thoughts
Burnaby South’s market is shifting—inventory is growing faster than demand, creating a more buyer-friendly environment, particularly in detached homes and condos. Sellers will need to adapt pricing strategies as buyers gain more options and negotiating power.
Download the Full Market Report
👉 For a tailored market update in your neighborhood or complex, reach out to us directly.