
Metro Vancouver Housing Market – August 2026
Summer Ends With Softer Sales and More Choice for Buyers
The Metro Vancouver housing market in August 2026 closed out the summer with softer sales, elevated inventory, and continued downward pressure on home prices. Sales remained well below historical averages, while buyers continued to benefit from ample selection across the market. Despite more favourable buying conditions, many prospective buyers remain on the sidelines, leaving the market balanced overall but increasingly tilted toward buyers in the detached segment.
Metro Vancouver Real Estate Stats – August 2026
Overall market activity remained subdued compared to both last year and long-term seasonal norms:
Total Sales: 1,869 (↓4.6% YoY)
10-Year Average Sales: 2,356 (↓20.7%)
New Listings: 4,100 (↓3.0% YoY)
Total Active Listings: 15,798 (↓2.7% YoY, ↑26.2% above 10-year average)
Benchmark Price (All Property Types): $1,081,900
- ↓5.6% YoY
- ↓0.6% MoM
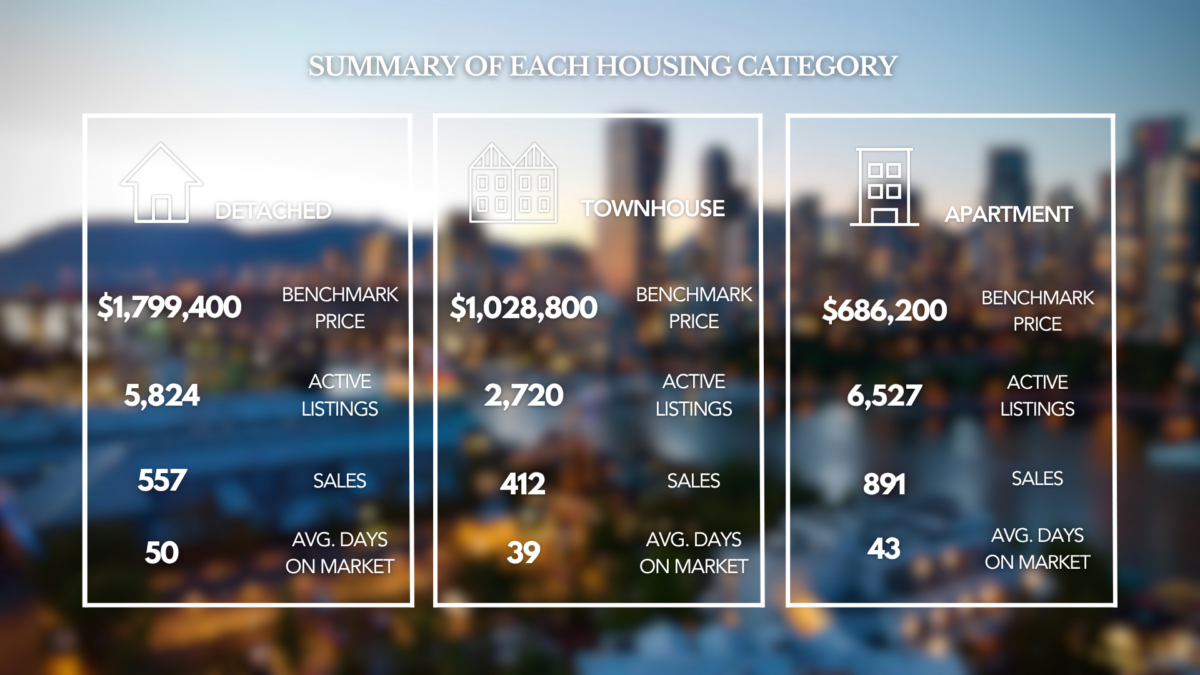
Detached Homes vs. Condos Vancouver: Segment Breakdown
Detached Homes
Active Listings: 5,824
Sales: 557 (↓3.1% YoY)
Benchmark Price: $1,799,400
- ↓7.2% YoY
- ↓1.3% MoM
Average Days on Market: 50
Takeaway: Detached homes continue to offer buyers significant choice and negotiating leverage. With the sales-to-active listings ratio below 10%, this segment remains the softest of the three major property types.
Townhouses
Active Listings: 2,720
Sales: 412 (↑0.7% YoY)
Benchmark Price: $1,028,800
- ↓4.4% YoY
- ↓0.2% MoM
Average Days on Market: 39
Takeaway: Townhomes were the only major property type to record a year-over-year increase in sales during August, although prices continued to soften modestly.
Apartments (Condos)
Active Listings: 6,527
Sales: 891 (↓6.8% YoY)
Benchmark Price: $686,200
- ↓6.6% YoY
- ↓0.3% MoM
Average Days on Market: 43
Takeaway: Condo demand remains subdued, with sales falling year-over-year despite ample inventory and lower benchmark prices.
Market Analysis: Summer Momentum Continues to Fade
The brief increase in demand seen at the beginning of summer did not carry through July and August.
According to Andrew Lis, Chief Economist and Vice-President of Data Analytics at Greater Vancouver REALTORS®, sales have been underperforming expectations since May:
“The market’s performance matched our expectations for the first four months of 2026, but since May, sales have lagged our January forecast, and we expect that trend to persist to the end of the year.”
August sales were 20.7% below the 10-year seasonal average, reinforcing just how cautious buyers remain despite conditions that would traditionally be considered favourable.
Several factors are shaping the current market:
- Inventory remains well above historical norms.
- Home prices continue to gradually soften.
- Mortgage rates have stabilized but remain too high to stimulate stronger demand.
- Investor demand has weakened.
- Slower immigration is reducing some sources of housing demand.
- Renewed Canada–U.S. trade tensions are adding another layer of economic uncertainty.
The result is a market where buyers have more choice and negotiating power, but many still lack the urgency to make a move.
Inventory Is Declining, But Remains Elevated
One of the more interesting trends beneath the headline sales numbers is what’s happening with housing supply.
There were 4,100 new listings in August, down 3% compared with August 2025 and 1.3% below the 10-year seasonal average.
Total active inventory declined to 15,798 homes, down 2.7% year-over-year.
However, inventory remains 26.2% above the 10-year seasonal average.
This means buyers still have considerably more selection than they would in a typical market, even though the overall supply of homes has begun gradually declining from its recent highs.
As Lis explained:
“This gradual decline, paired with slower-than-usual sales, has caused prices to drift downwards across all market segments.”
For now, declining inventory has not been enough to offset weak demand or create meaningful upward pressure on prices.
Sales-to-Active Listings Ratio: Why It Matters
The Sales-to-Active Listings Ratio (SALR) helps show whether market conditions are favouring buyers or sellers.
Overall Market: 12.3%
Detached: 9.6%
Townhomes: 15.1%
Apartments: 13.7%
How to Interpret This:
Below 12% → Buyer’s Market
Downward pressure on prices can occur when the ratio remains below this level for a sustained period.
12%–20% → Balanced Market
Neither buyers nor sellers hold a significant overall advantage.
Above 20% → Seller’s Market
Sustained ratios above this level can contribute to upward pressure on prices.
What This Means Right Now:
- Detached homes (9.6%) are firmly in buyer’s market territory.
- Townhomes (15.1%) remain balanced.
- Apartments (13.7%) remain balanced but lean softer.
- The overall market (12.3%) is sitting just above the threshold traditionally associated with buyer’s market conditions.
This explains why benchmark prices continue to gradually decline without experiencing a dramatic correction.
Demand remains soft enough to give buyers leverage, but not every segment is experiencing the same degree of pressure.
What This Means for Buyers and Sellers
For Buyers
August’s market conditions continue to provide buyers with several advantages:
- Inventory remains elevated → more choice
- Benchmark prices are lower → improved purchasing opportunities
- Sales remain subdued → less competition
- Detached homes are in buyer’s market territory → greater negotiating leverage
The combination of ample selection, softer pricing, and stable mortgage rates would typically encourage more buyers into the market.
So far, that hasn’t happened at scale.
For buyers who are financially prepared and planning to own for the longer term, this environment may provide opportunities that become harder to find if demand eventually strengthens.
For Sellers
This remains a market where simply putting a property on the MLS® is not enough.
- Pricing needs to reflect current conditions.
- Presentation and marketing are critical.
- Buyers have plenty of alternatives.
- Properties that sit too long can lose momentum.
- Market conditions vary considerably by property type and neighbourhood.
Detached sellers face particularly challenging conditions, with the sales-to-active listings ratio at just 9.6%.
Townhome sellers are seeing somewhat stronger conditions, while condo sellers continue competing for buyers within a well-supplied market.
Final Thoughts
The Metro Vancouver Housing Market in August 2026 ended the summer with softer demand and continued downward pressure on prices.
We are seeing:
- Sales down 4.6% year-over-year.
- Sales activity 20.7% below the 10-year seasonal average.
- Inventory still 26.2% above historical norms.
- Benchmark prices declining across all major property types.
- Detached homes firmly in buyer’s market territory.
- Townhomes showing the strongest relative sales performance.
- Buyers remaining cautious despite more favourable conditions.
The biggest takeaway is that Metro Vancouver remains a strategy market.
Buyers have more selection, less competition, and greater negotiating leverage than they have had in many recent markets. Sellers, meanwhile, need to be realistic about pricing and deliberate about how their property is positioned.
The market may be soft, but that doesn’t mean there aren’t opportunities. It means those opportunities increasingly depend on the specific property, neighbourhood, and strategy.
Browse current opportunities across Metro Vancouver:
👉 Search for Properties
Read Next:
👉 This is What the Next Chapter Looks Like: 2305 W King Edward, Vancouver
👉 The Kitchen That Was Built to Be Used: Inside 2305 W King Edward, Arbutus
👉 When Paying a Mortgage Penalty Actually Makes Sense
👉 Why I Bought During the 2025 Volatility and What That Has To Do With Last Week’s Rate Drop
👉 Why Two Years Left on Your Mortgage Does Not Automatically Mean You Should Wait
Ehsan Sharenejad PREC*
Powered by Propel Real Estate Marketing Inc.
778-910-2876