
Metro Vancouver Housing Market – July 2026
Home Sales Lose Summer Momentum
The Metro Vancouver housing market in July 2026 took a step back after the broad-based sales increase seen in June. Residential sales declined nearly 10% year-over-year, with apartment sales experiencing the sharpest slowdown. At the same time, fewer new listings are coming to market and overall inventory has begun to decline. While prices remain relatively stable, the market continues to show a cautious, balanced environment where buyers and sellers are closely watching what happens next.
Metro Vancouver Real Estate Stats – July 2026
Overall market activity softened compared to last year and remains below long-term seasonal averages:
Total Sales: 2,061 (↓9.8% YoY)
10-Year Average Sales: 2,532 (↓18.6%)
New Listings: 4,991 (↓11.5% YoY)
Total Active Listings: 16,476 (↓4.0% YoY, ↑26.8% above 10-year average)
Benchmark Price (All Property Types): $1,088,800
- ↓6.2% YoY
- ↓0.9% MoM
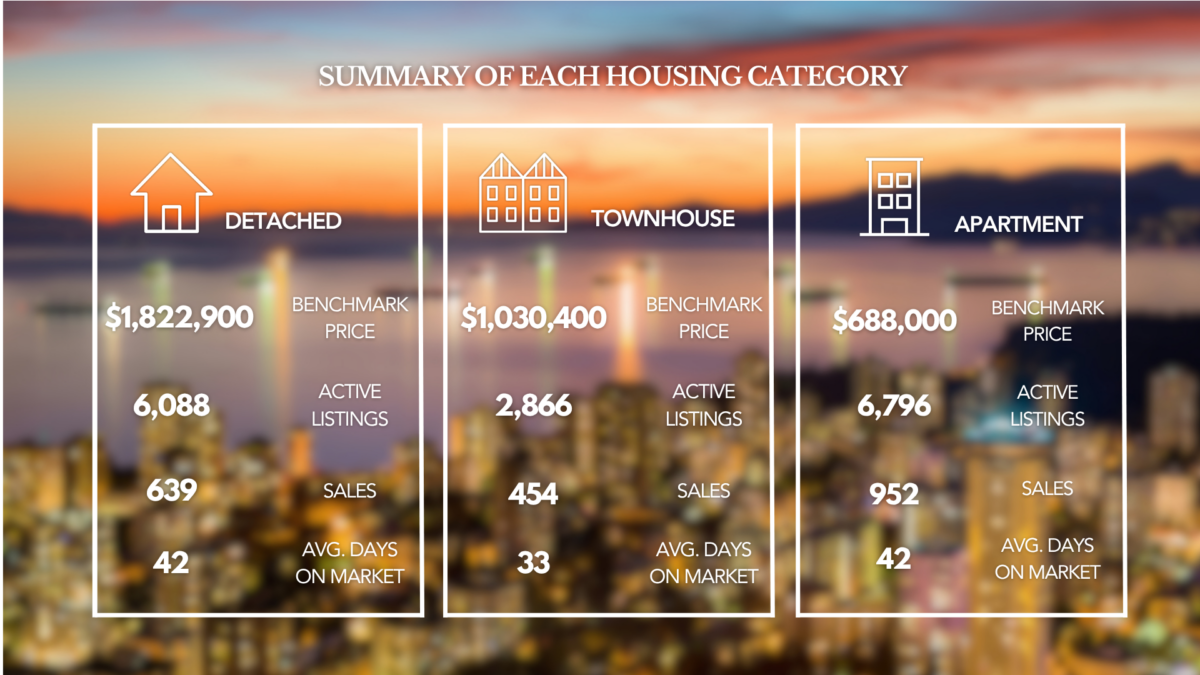
Detached Homes vs. Condos Vancouver: Segment Breakdown
Detached Homes
Active Listings: 6,088
Sales: 639 (↓3.2% YoY)
Benchmark Price: $1,822,900
- ↓7.0% YoY
- ↓1.1% MoM
Average Days on Market: 42
Takeaway: Detached homes remained more resilient than other segments, with sales declining only modestly compared with the much sharper drop in apartment activity.
Townhouses
Active Listings: 2,866
Sales: 454 (↓1.1% YoY)
Benchmark Price: $1,030,400
- ↓6.0% YoY
- ↓1.5% MoM
Average Days on Market: 33
Takeaway: Townhomes remained relatively stable, with sales nearly matching last year’s levels despite softer overall market activity.
Apartments (Condos)
Active Listings: 6,796
Sales: 952 (↓17.8% YoY)
Benchmark Price: $688,000
- ↓7.5% YoY
- ↓1.0% MoM
Average Days on Market: 42
Takeaway: Apartments experienced the largest decline in demand, confirming that the June increase in sales did not translate into sustained momentum across the condo market.
Market Analysis: One Step Forward, One Step Back
After June’s broad-based increase in sales across all property types, July brought a noticeable reversal.
According to Andrew Lis, Chief Economist at Greater Vancouver REALTORS®, the market continues to follow a pattern of inconsistent momentum:
“Over the past few years, the sales activity story has often been one step forward, one step back, and the June and July data are a prime example of this pattern.”
The numbers support that assessment. June sales increased 9.6% year-over-year, only for July sales to fall 9.8%.
The biggest shift occurred in the apartment segment, where sales dropped 17.8% compared with July 2025.
Meanwhile:
- Detached sales declined only 3.2%.
- Townhouse sales declined just 1.1%.
- Apartment sales declined 17.8%.
- Overall sales remained well below the 10-year average.
This reinforces the idea that the Vancouver real estate market is not moving uniformly. Different property types continue to experience very different levels of demand.
Inventory Is Beginning to Decline
One of the more important developments in July was the continued slowdown in new listings.
There were 4,991 new listings, down 11.5% from July 2025 and essentially in line with the 10-year seasonal average.
Total active listings also declined to 16,476, down 4% year-over-year.
While inventory remains 26.8% above the 10-year average, the direction is worth watching.
Lis noted:
“We’ve been pointing to the slowdown in sellers coming to market for several months, and it’s beginning to translate into a gradual decline in the overall inventory level.”
This creates an interesting dynamic.
Demand is currently soft, but fewer sellers are entering the market. If buyer demand eventually strengthens while the supply of new listings remains limited, the balance between buyers and sellers could shift.
For now, however, there is not enough evidence to suggest significant upward or downward price pressure.
Sales-to-Active Listings Ratio: Why It Matters
The Sales-to-Active Listings Ratio (SALR) is one of the most useful indicators for understanding whether a market is favouring buyers or sellers.
Overall Market: 13.0%
Detached: 10.5%
Townhomes: 15.8%
Apartments: 14.0%
How to Interpret This:
Below 12% → Buyer’s Market
Downward pressure on prices can occur when the ratio remains below this level for a sustained period.
12%–20% → Balanced Market
Neither buyers nor sellers have a significant overall advantage.
Above 20% → Seller’s Market
Prices can experience upward pressure when demand consistently exceeds available supply.
What This Means Right Now:
- Detached homes (10.5%) remain in buyer’s market territory.
- Townhomes (15.8%) are in balanced market territory.
- Apartments (14.0%) are also in balanced territory.
- Overall market (13.0%) remains balanced, but relatively soft.
This helps explain why prices continue to move gradually rather than dramatically.
Despite lower inventory, sales are not strong enough to create significant upward pressure on prices.
What This Means for Buyers and Sellers
For Buyers
July continues to offer buyers opportunities, particularly for those who are patient and selective.
- Inventory remains well above historical averages.
- Detached homes remain in buyer’s market territory.
- Sales have slowed, reducing immediate competition.
- Sellers may have greater flexibility on properties that have been sitting on the market.
However, buyers should also pay attention to the declining inventory trend.
If fewer sellers continue entering the market and demand eventually strengthens, today’s negotiating environment could become more competitive.
For Sellers
The market remains challenging for sellers, but the picture is not entirely negative.
- Buyers remain active, even though overall sales have slowed.
- Well-priced homes continue to attract attention.
- Fewer competing new listings could eventually improve conditions for sellers.
- Detached and townhouse properties are showing greater sales resilience than apartments.
For sellers, the key remains realistic pricing and strong positioning. In a market where buyers have options, properties that stand out in terms of price, condition, and presentation are more likely to generate activity.
Final Thoughts
The Metro Vancouver Housing Market in July 2026 lost some of the momentum it appeared to gain in June.
We are seeing:
- Sales decline 9.8% year-over-year.
- Apartment sales experience the sharpest slowdown.
- Detached and townhouse sales remain relatively resilient.
- New listings decline 11.5%.
- Total inventory fall 4% year-over-year.
- Prices remain relatively stable but below last year’s levels.
- The overall market remain balanced, with detached homes still in buyer’s market territory.
The biggest takeaway is that the market continues to move cautiously rather than decisively.
June suggested that demand could be returning across Metro Vancouver. July showed that the recovery is not yet established.
At the same time, declining inventory could become an increasingly important factor. If demand strengthens while fewer sellers bring homes to market, the market could gradually tighten later in the year.
For now, buyers and sellers should focus less on broad market headlines and more on the specific segment, neighbourhood, and property they are dealing with.
Browse current opportunities across Metro Vancouver:
👉 Search for Properties
Read Next:
👉 This is What the Next Chapter Looks Like: 2305 W King Edward, Vancouver
👉 The Kitchen That Was Built to Be Used: Inside 2305 W King Edward, Arbutus
👉 When Paying a Mortgage Penalty Actually Makes Sense
👉 Why I Bought During the 2025 Volatility and What That Has To Do With Last Week’s Rate Drop
👉 Why Two Years Left on Your Mortgage Does Not Automatically Mean You Should Wait
Ehsan Sharenejad PREC*
Powered by Propel Real Estate Marketing Inc.
778-910-2876