
Metro Vancouver Housing Market – October 2026
Buyers and Sellers Step Back Amid Economic Uncertainty
The Metro Vancouver housing market in October 2026 experienced another slowdown, with both home sales and new listings declining by approximately 10% year-over-year. Following several months of softer activity, buyers and sellers appear to be taking a more cautious approach as uncertainty surrounding mortgage rates, the Bank of Canada’s unexpected rate hike, and provincial and municipal elections influence real estate decisions. While benchmark prices continue to decline and inventory remains elevated, the market is showing signs of a prolonged period of cautious activity heading into the final months of 2026.
Metro Vancouver Real Estate Stats – October 2026
Overall market activity slowed compared to October last year, with sales remaining significantly below historical averages:
- Total Sales: 2,024 (↓10.2% YoY)
- 10-Year Average Sales: 2,612 (↓22.5%)
- New Listings: 4,805 (↓11.6% YoY)
- Total Active Listings: 15,688 (↓4.3% YoY, ↑24% above 10-year average)
- Benchmark Price (All Property Types): $1,068,600
- ↓5.2% YoY
- ↓0.7% MoM
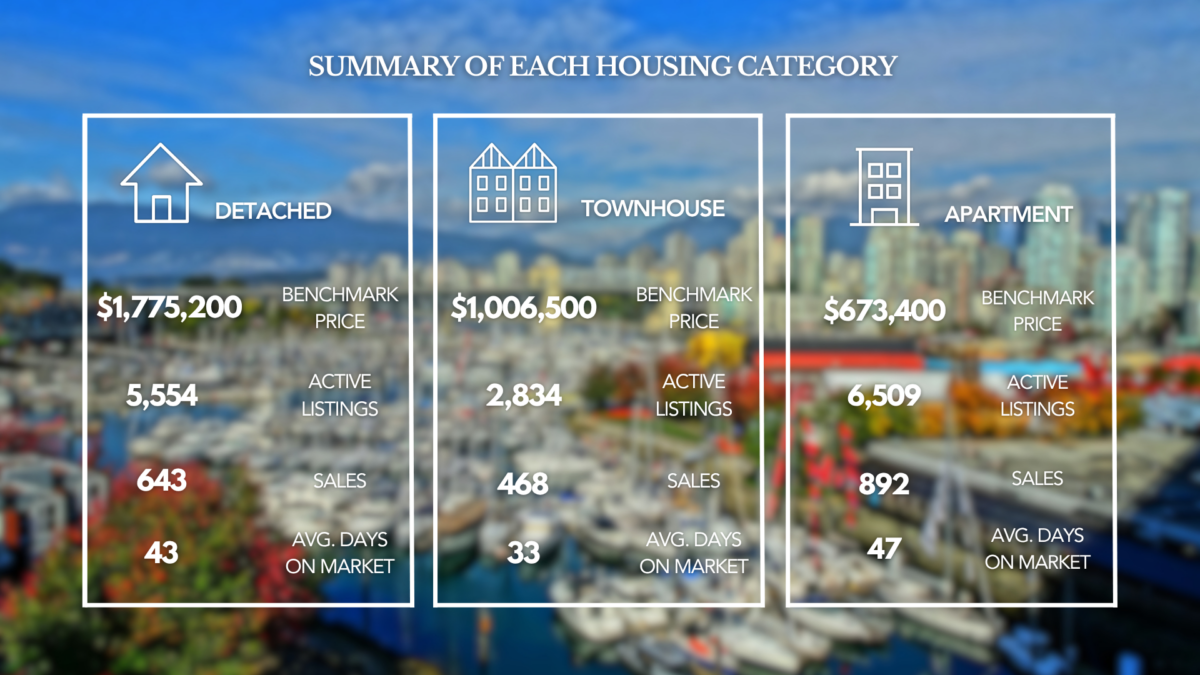
Detached Homes vs. Condos Vancouver: Segment Breakdown
Detached Homes
- Active Listings:
- Sales: 643 (↓7.2% YoY)
- Benchmark Price: $1,775,200
- ↓7.0% YoY
- ↓0.5% MoM
- Average Days on Market:
Takeaway: Detached home sales declined compared to last year, while benchmark prices continued to soften. With the sales-to-active listings ratio approaching buyer’s market territory, detached buyers may have more room to negotiate.
Townhouses
- Active Listings:
- Sales: 468 (↓1.9% YoY)
- Benchmark Price: $1,006,500
- ↓5.5% YoY
- ↓1.0% MoM
- Average Days on Market:
Takeaway: Townhouses remained the most resilient segment in terms of sales activity, with the smallest year-over-year decline among the three major property types. However, prices continued to move downward.
Apartments (Condos)
- Active Listings:
- Sales: 892 (↓16.7% YoY)
- Benchmark Price: $673,400
- ↓5.9% YoY
- ↓1.3% MoM
- Average Days on Market:
Takeaway: Apartments continued to experience the greatest weakness in demand. Sales declined significantly year-over-year, while prices recorded the largest monthly decrease among the three segments.
Market Analysis: Buyers and Sellers Step Back
October’s Vancouver real estate stats reflect a market where uncertainty is influencing decisions on both sides of the transaction.
According to Andrew Lis, Chief Economist and Vice-President of Data Analytics at Greater Vancouver REALTORS®, several developments contributed to the slowdown:
“October came with a few suspenseful distractions for buyers and sellers alike, with a somewhat surprising Bank of Canada rate hike and a snap provincial election among them.”
The unexpected interest rate increase and political uncertainty appear to have encouraged market participants to pause and reassess their plans.
This hesitation is reflected in the numbers:
- Detached homes: Sales declined 7.2% year-over-year.
- Townhouses: Sales declined 1.9%.
- Apartments: Sales declined 16.7%.
- Overall market: Sales were 22.5% below the 10-year seasonal average.
The apartment segment continues to experience the sharpest slowdown, while townhouses are showing comparatively greater resilience.
This reinforces a trend seen throughout 2026: the Metro Vancouver housing market is not moving uniformly, and different property types are responding differently to affordability challenges and changing buyer sentiment.
Mortgage Rates and Economic Uncertainty Continue to Influence Buyers
One of the biggest developments in October was the Bank of Canada’s unexpected quarter-point interest rate increase.
For buyers who have been waiting for more favourable market conditions, the decision creates another affordability consideration.
Throughout 2026, benchmark prices have gradually declined, giving buyers some improvement in purchasing power. However, higher borrowing costs can offset those gains by increasing monthly mortgage payments.
Lis highlighted this challenge:
“It’s a difficult quandary for buyers who’ve watched prices edge lower throughout the year, only to see those affordability gains eroded by higher borrowing costs.”
This creates a challenging environment for prospective buyers.
On one hand, lower home prices and elevated inventory offer more opportunities to negotiate. On the other hand, uncertainty around mortgage rates makes it harder to determine whether waiting will improve affordability.
The possibility of another quarter-point rate increase in December may also influence buyers with mortgage rate holds approaching expiration.
For sellers, this uncertainty means that buyers may take longer to make decisions, reinforcing the importance of realistic pricing and effective property marketing.
Sales-to-Active Listings Ratio: Why It Matters
The Sales-to-Active Listings Ratio (SALR) is one of the most useful indicators for understanding whether market conditions favour buyers or sellers.
For October 2026, the sales-to-active listings ratios were:
Overall Market: 13.4%
Detached: 11.6%
Townhomes: 16.5%
Apartments: 13.5%
How to Interpret This:
Below 12% → Buyer’s Market
Sustained ratios below this level can create downward pressure on home prices.
12%–20% → Balanced Market
Neither buyers nor sellers have a significant overall advantage.
Above 20% → Seller’s Market
Sustained ratios above this level can contribute to upward pressure on prices.
These are general market indicators rather than guarantees of future price movements.
What This Means Right Now:
- Detached homes (11.6%) are just below the threshold associated with buyer’s market conditions.
- Townhomes (16.5%) remain in balanced market territory.
- Apartments (13.5%) remain balanced, although demand is relatively soft.
- The overall market (13.4%) remains balanced.
Compared with September, when the overall ratio was 10.9%, October saw a modest improvement in the sales-to-active listings ratio.
However, this does not necessarily indicate a stronger market. The ratio can change as sales and active listings move in different directions.
The broader picture remains one of cautious buyers, elevated inventory, and gradual price declines.
What This Means for Buyers and Sellers
For Buyers
October’s market offers opportunities, but buyers need to consider both property prices and borrowing costs.
- Elevated inventory → More choice: Buyers can compare properties and take more time before making decisions.
- Declining benchmark prices → Potential opportunities: Prices remain below last year’s levels across all major property types.
- Softer sales → Less competition: Buyers may have more negotiating flexibility.
- Higher borrowing costs → Careful financial planning: Mortgage rates can offset some of the affordability gains from lower home prices.
For buyers who are financially prepared, this environment may provide opportunities to negotiate favourable terms.
However, waiting for prices to decline further does not guarantee a better overall purchase if mortgage rates increase.
The important consideration is finding the right property at a price and monthly payment that make sense for your financial situation.
For Sellers
For sellers, October reinforces the importance of entering the market with realistic expectations.
- Pricing strategy is critical: Buyers are more sensitive to asking prices.
- Presentation matters: Professional photography, staging, and effective marketing can help a property stand out.
- Competition remains elevated: Buyers have plenty of alternatives.
- Market conditions vary by property type: Townhouses are showing greater sales resilience than apartments and detached homes.
Sellers should also recognize that the market is being influenced by factors beyond property-specific characteristics.
Mortgage rate uncertainty and broader economic conditions can affect buyer confidence, even when a property is well-presented.
A thoughtful pricing and marketing strategy can help attract serious buyers in an environment where hesitation is becoming increasingly common.
Final Thoughts
The Metro Vancouver Housing Market in October 2026 continued its pattern of slower activity, with buyers and sellers taking a more cautious approach amid economic and political uncertainty.
We are seeing:
- Overall sales decline 10.2% year-over-year.
- New listings decline 11.6%.
- Total active inventory remain 24% above historical averages.
- Benchmark prices decline across all major property types.
- Apartment sales experience the largest year-over-year decline.
- Townhouses demonstrate the strongest relative sales performance.
- Mortgage rate uncertainty continue influencing buyer decisions.
The biggest takeaway is that Metro Vancouver remains a market defined by hesitation and affordability challenges.
Buyers are benefiting from lower benchmark prices and greater selection, but higher borrowing costs are complicating purchasing decisions. Sellers, meanwhile, are facing a smaller pool of motivated buyers and need to be strategic about pricing and presentation.
As we approach the end of 2026, the defining question is whether market activity will regain momentum or whether the cautious conditions we’ve experienced throughout much of the year will carry into 2027.
For both buyers and sellers, understanding the specific conditions within each property segment will be essential to making informed real estate decisions.
Browse current opportunities across Metro Vancouver:
👉 Search for Properties
Read Next:
👉 This is What the Next Chapter Looks Like: 2305 W King Edward, Vancouver
👉 The Kitchen That Was Built to Be Used: Inside 2305 W King Edward, Arbutus
👉 When Paying a Mortgage Penalty Actually Makes Sense
👉 Why I Bought During the 2025 Volatility and What That Has To Do With Last Week’s Rate Drop
👉 Why Two Years Left on Your Mortgage Does Not Automatically Mean You Should Wait
Ehsan Sharenejad PREC*
Powered by Propel Real Estate Marketing Inc.
778-910-2876